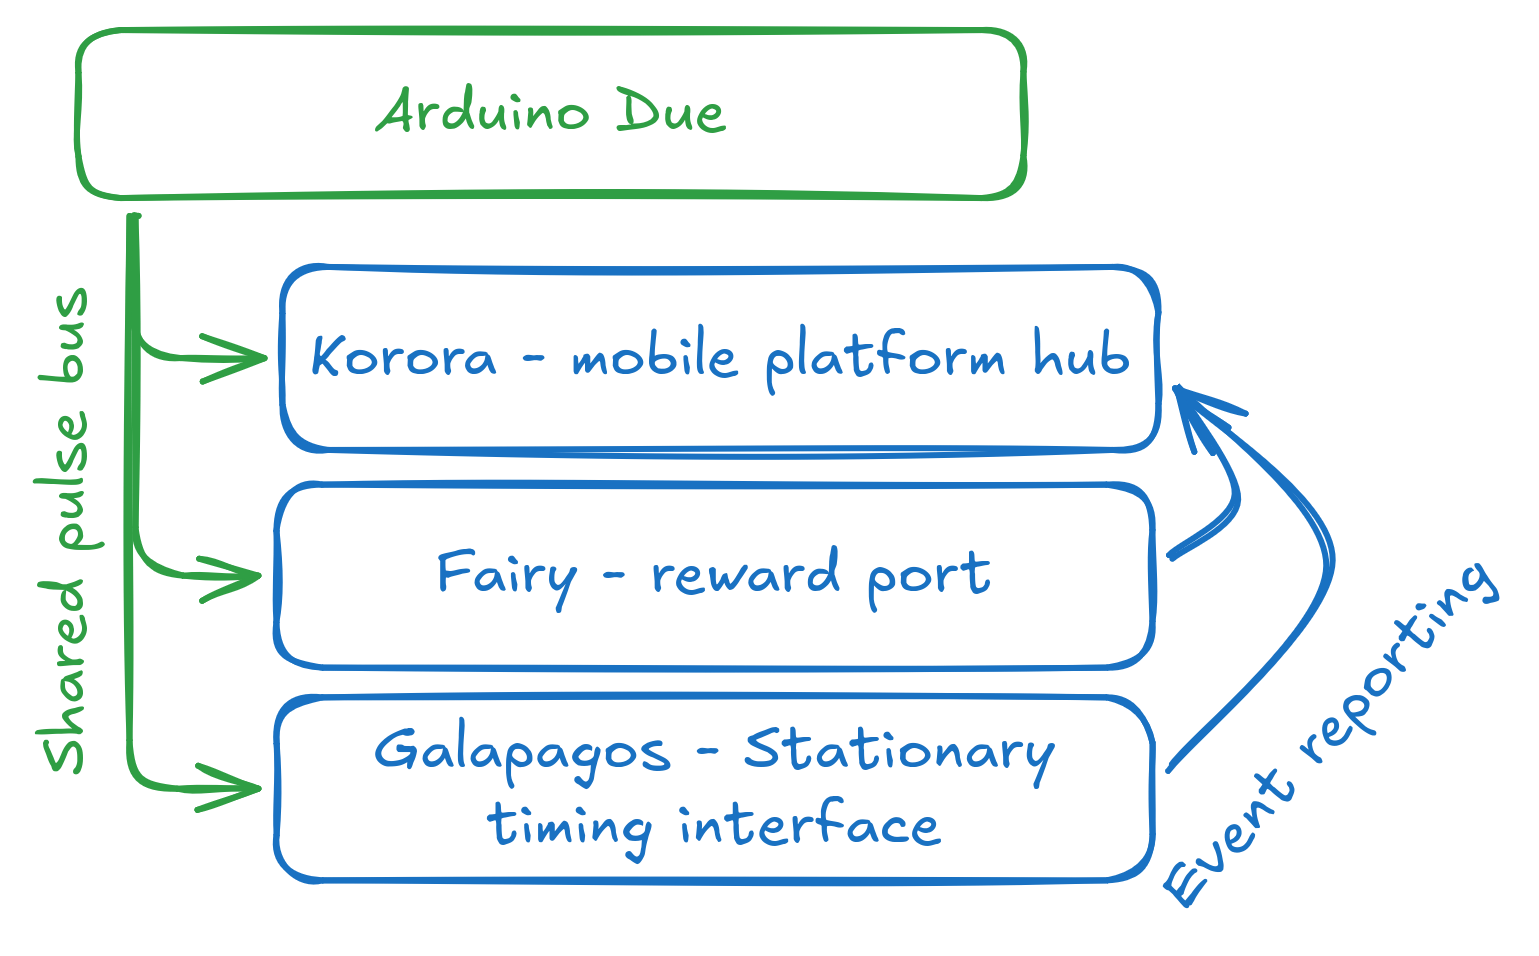
Tests cross-device timestamp alignment.
Validation
Validation
Independent electrical references, physical output capture and long-duration logging were used to test cross-device timing, TTL execution and system stability.
Validation methods
Separating model error, output error and delivery delay
The tests distinguish clock-model error, physical execution error, and communication or delivery delay.
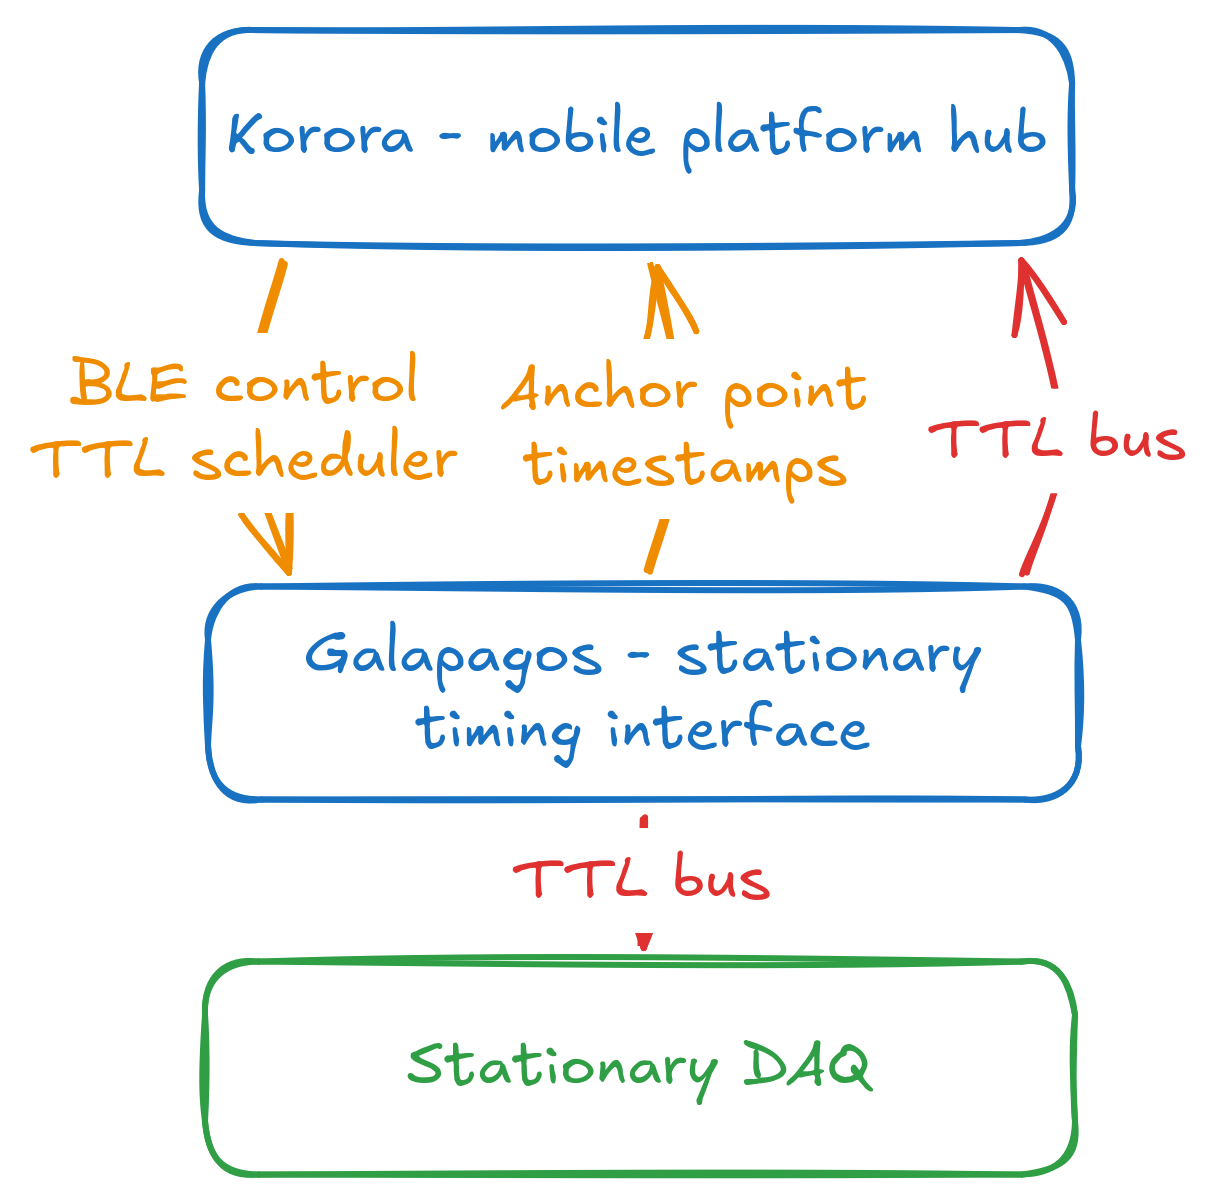
Tests schedule-to-output accuracy.
Related plots
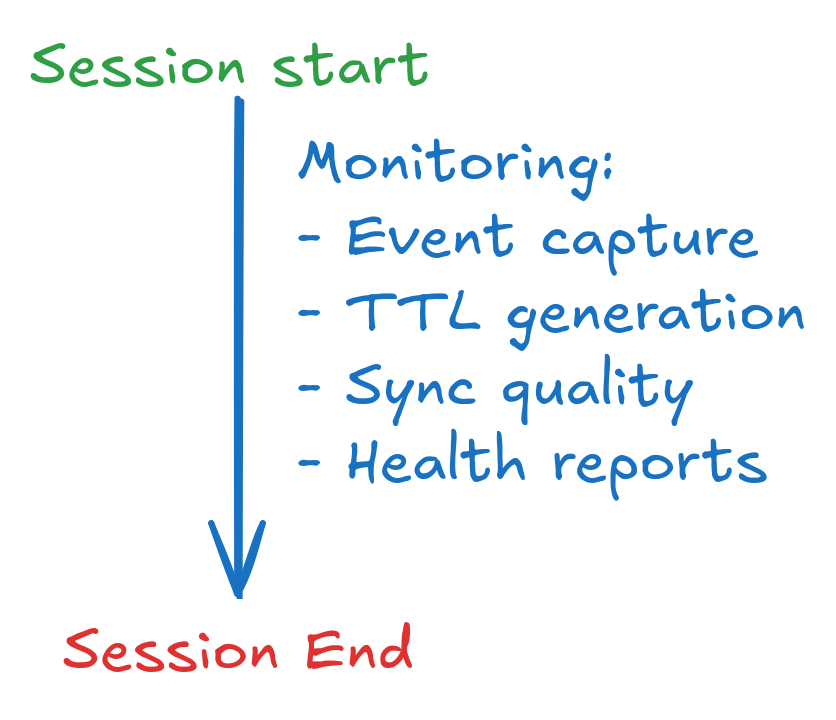
Tests synchronisation, delivery and node health over time.
Related plots
Featured results
Main validation figures
These plots provide the primary route into the validation results. Numerical summaries are limited to values visible in the supplied figures.
Cross-device event timing error
Shared external pulses test whether independently clocked devices report the same physical event on a common timeline.
Result statement: Shared external pulses aligned events across independently clocked devices.
Galapagos TTL alignment
Physical TTL edges are compared with their scheduled execution times across the validation sequence.
Result statement: Physical TTL outputs remained consistently close to their scheduled times.
One-step clock prediction error
Distribution of one-step timing predictions across synchronised remote devices.
Result statement: 17,408 predictions formed a centred, repeatable error distribution.
Clock synchronisation
Affine clock models
Synchronisation records test whether remote-device timestamps can be translated onto the Korora timeline with stable one-step prediction behaviour.
Event timing
External pulse agreement
Shared electrical events provide a reference for comparing timestamps produced by Korora, Fairy controllers and Galapagos after clock translation.
TTL timing
Scheduled physical outputs
TTL validation compares requested output times, Galapagos scheduling records and physical edges captured by an independent reference.
Communication
Command and BLE transport
Communication plots describe command round-trip timing, BLE direction latency and link quality. Delivery behaviour is reported separately from the timestamp assigned to a physical event.
Delivery and health
Completeness and continuity
Long-duration logs track record delivery, node health and gaps in observed records. This separates transport continuity from physical-event timing error.
Extended plots
Complete plot collection
The complete plot catalogue is indexed here as a compact static table. Filtering and search run in the browser against page data.
Measures the transport portion of each Adelie-to-Korora clock exchange.
Checks whether BLE transport latency is symmetric in the two directions.
Provides the complete host-side view of BLE performance and congestion.
Shows how accurately the rolling affine model represents Adelie and Korora time.
Shows the error observed when the current clock model predicts the next synchronisation point.
Tracks drift in the host clock-rate estimate used by the synchronisation model.
Shows where time is spent as commands travel through BLE, Korora, I²C and Fairy processing.
Measures complete command-response latency as observed by Adelie.
Compares the number of application events reported by each device.
Shows when application events occurred and which device reported them.
Measures routine BLE clock-exchange latency between Adelie and Korora.
Tracks wireless signal strength and helps distinguish radio degradation from software congestion.
Distinguishes a stopped or reset device clock from delayed BLE delivery.
Separates Korora processing from BLE transport latency during clock exchange.
Compares command latency distributions across command types.
Shows the complete latency distribution, including tails, for each command type.
Shows which command types succeed, fail or time out.
Uses counter deltas to expose bursts without misleading cumulative totals.
Shows cross-device event alignment against the Korora reference timeline.
Compares event timing bias and spread using sample count, median, absolute P95 and absolute maximum.
Measures end-to-end latency for non-clock experiment commands.
Shows how strongly each accepted synchronisation observation changes the model.
Compares firmware fit quality against the independent analysis model.
Tracks short-term prediction accuracy and model-reset effects.
Summarises prediction bias and tail error for Fairy clock model.
Compares measured interval-rate error with the firmware clock-rate estimate.
Tests whether unstable clock intervals degrade synchronisation model quality.
Shows clock-model availability and reset periods throughout the recording.
Tests whether delayed event delivery is associated with timestamp conversion error.
Shows how long event records take to arrive after capture.
Shows when external event timestamps are synchronized and when conversion is unavailable.
Tracks converted external-event timing error against the Korora reference.
Summarises event timing bias, spread and tail error for Fairy.
Provides a diagnostic view of the timing offset seen when an event record arrives.
Measures how long synchronisation observations take to reach the analysis path.
Checks the cadence and continuity of synchronisation observations.
Shows how strongly each accepted synchronisation observation changes the model.
Compares firmware fit quality against the independent analysis model.
Tracks short-term prediction accuracy and model-reset effects.
Summarises prediction bias and tail error for Galapagos clock model.
Compares measured interval-rate error with the firmware clock-rate estimate.
Tests whether unstable clock intervals degrade synchronisation model quality.
Shows clock-model availability and reset periods throughout the recording.
Tests whether delayed event delivery is associated with timestamp conversion error.
Shows how long event records take to arrive after capture.
Shows when external event timestamps are synchronized and when conversion is unavailable.
Tracks converted external-event timing error against the Korora reference.
Summarises event timing bias, spread and tail error for Galapagos.
Provides a diagnostic view of the timing offset seen when an event record arrives.
Measures how long synchronisation observations take to reach the analysis path.
Checks the cadence and continuity of synchronisation observations.
Breaks command latency into the stages observed by Adelie on the host.
Breaks command latency into the stages measured inside Korora.
Checks the cadence and stability of the reference events used for cross-device alignment.
Highlights the worst observed record-delivery interruption for every device.
Tracks queue pressure, record loss and transport faults for each device.
Shows both when record silences occur and how their durations are distributed.
Shows the cadence of records reaching Adelie from every device.
Compares record cadence across devices and Fairy record categories.
Shows whether TTL requests complete every stage of the scheduling and acquisition path.
Separates the contributions to scheduled TTL timing accuracy.
Summarises completed TTL end-to-end timing error using median, absolute P95 and absolute maximum.
Validates the internal consistency of generation, acquisition and total-error fields.
Shows when each clock model has enough observations and whether it is acquiring or tracking.
Examines the raw timing pairs used to update each device clock model.
Compares immediate clock predictions with the residual error of the rolling fit.
Summarises the centre, spread and tails of one-step clock prediction errors.
Tracks clock-model fit quality and clock-rate error throughout the recording.
Compares synchronisation accuracy and rate error across devices.
Measures alignment between scheduled Galapagos TTL pulses and Korora acquisition.
Checks that TTL requests reach every pipeline stage and quantifies generation and capture error.
Compares relationships between recorded validation metrics to identify coupled timing and delivery behaviours.